Generating maps of planetary surfaces
The program MapMaker is designed to generate maps based on digital planetary images. The original image is projected into the respective planetographic longitude and latitude coordinate system. Drawings can be processed as well, provided that the background is black. The program MapMaker is primarily suitable for the planet Jupiter and for Mars near its opposition, but not for images on which a significant phase effect of the planet is apparent, as it is the case for Mercury, Venus, and Mars before and after its opposition. For planet disks showing a phase effect I have written the program MapMaker_Phase (also contained in the download file). The third program of the package, MapMaker_Phase_Polar, generates a map of the north or south polar region of the planet, centered on the respective pole. This program is specially suitable for generating perpendicular views of the Martian polar ice caps.
The download file contains the programs as 32 bit Windows executable files to be started as command line applications in an MS DOS Box under all 32 bit Windows systems, along with the corresponding source code and example images. The source code can be compiled with an ANSI C compiler as a command line application under arbitrary operating systems. I have tested the code under Windows using Borland C++ 5.0 and Microsoft Visual C++ 6.0 and under Linux using the gcc compiler. The executable files and source codes are public domain and may be freely distributed.
Download MapMaker 1.2, MapMaker_Phase 1.3, MapMaker_Phase_Polar 1.2
MapMaker: Fully illuminated planet disk
The program MapMaker has to be called in the following manner:
MapMaker <IMGFILE> <MAPFILE> <CM> <B0> <XLO> <YLO> <XLW> <YLW> <ITHR> <DELTA> <GPP> <BETA>
IMGFILE
Name of the image file in the PPM format which is very common on UNIX
systems. Under Windows, PPM images can be displayed, generated from other
file formats, and converted to other image formats with the very powerful
free software IrfanView. The PPM
format was chosen as it is very simple, such that the source code remains
compact and simple. The image must contain only one single planet disk.
The program furthermore assumes that the planet disk is orientated roughly
with its northern pole to the top.
MAPFILE
Name of the map file to be generated (PPM image file). The map is shown
in cylindrical projection.
CM
Central meridian in degrees (corresponding to the Ob-lon parameter
of the JPL Ephemeris Generator).
B0
Inclination of the equatorial plane to the line of sight (corresponding
to minus the Ob-lat parameter of the JPL
Ephemeris Generator).
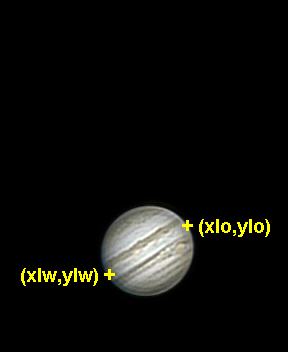
XLO, YLO
Pixel coordinates of the eastern (right) limb of the planet disk according
to the figure below.
YLW, YLW
Pixel coordinates of the western (left) limb of the planet disk according
to the figure below.
ITHR
Intensity threshold that defines which pixel belongs to the planet
disk. Reasonable values for PPM images with 8 bits per colour channel are
between 10 and 30.
DELTA
Maximum angle (in degrees) between line of sight and surface of the
planet. Values between 0° and 90° are possible, reasonable values
are generally between 60° and 80°, depending on how accurately
the limb area of the planet disk is reproduced in the image.
GPP
Scale of the map in degrees longitude/latitude per pixel. This value
depends on the reolution of the image.
BETA
Limb darkening coefficient. This parameter is necessary for Jupiter
only; for all other planets, it should be set to 0. I assume the relation
I(q) / I(0) = (1 + BETA cos q)
/ (1 + BETA) usually adopted for the sun, with q as
the angle between line of sight and surface normal. Of course I am aware
of the fact that the physical mechanism leading to Jupiter's limb darkening
is different from that of the sun: The surface of Jupiter's clouds displays
a Lambert-like reflectance characteristic (the brightness, however, does
not decrease as strongly as ~ cos q,
as otherwise the limb of Jupiter's disk would be completely dark), while
in the case of the sun, one looks into higher and cooler layers of the
solar atmosphere at the limb of its apparent disk. Empricially, however,
the above limb darkening relation is a good description also for Jupiter.
BETA = 0 means that no limb darkening is present. In the example
given below BETA = 1.6 was used.
After starting the program without parameters a short help text appears.
For testing, the image file jupiter.ppm contained in the download file
has to be copied into the same directory as the executable file mapmaker.exe,
and the program has to be started as follows:
mapmaker jupiter.ppm map.ppm 129.4 0 188 227 108 277 20 55 1 1.6
After less than a second the map image map.ppm has been generated, which looks like this:
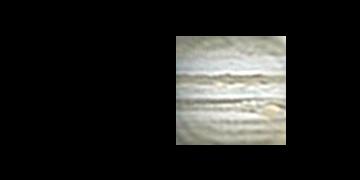
North is to the top, west to the left, the equator corresponds to a horizontal line at y = 90, and the zero meridian corresponds to the right border of the map. The planetographic longitude is increasing from the right to the left. The Great Red Spot (GRS) is located at x = 272 and y = 111, which, at a scale of 1° per pixel, corresponds to the planetographic coordinates l = 88° (System II) and b = -21°.
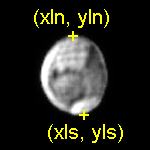
MapMaker_Phase: Taking into account the phase
For the program MapMaker_Phase, instead of the eastern and western limb of the planet disk (XLO, YLO, XLW, YLW) the user has to supply its northern and southern limb (parameters XLN, YLN, XLS, YLS; 5th, 6th, 7th, and 8th program parameter, see figure below).
After starting the program without parameters a short help text appears. For testing, the image file mars.ppm contained in the download file has to be copied into the same directory as the executable file mapmaker_phase.exe, and the program has to be started as follows:
mapmaker_phase mars.ppm map.ppm 316.7 21 50 25 59 75 20 70 1.5 0
The resulting map image looks like this:
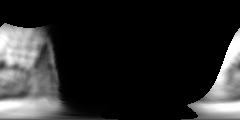
The scale of this map image was set to 1.5° longitude/latitude per pixel due to the small size of the planet disk. North is to the top, west to the left, the equator corresponds to a horizontal line at y = 60, and the zero meridian corresponds to the right border of the map. The planetographic longitude is increasing from the right to the left.
MapMaker_Phase_Polar: Generating perpendicular views of the polar regions
The third program of the package, MapMaker_Phase_Polar, is designed to generate a perpendicular view of the northern or southern polar region of the planet. Between the parameters ITHR and DELTA the following parameters have to be added:
N/S
With N or n the north pole, with S or s
the south pole of the planet is displayed.
MIN_BETA
Limit of the latitude range to be displayed (in degrees).
For the example image mars.ppm, the program has to be started in the following manner:
mapmaker_phase_polar mars.ppm map.ppm 316.7 21 50 25 59 75 20 S 50 70 1.0 0
The resulting map of the Martian south pole image looks like this:

The pole is marked by a green cross, the scale of the map (in degrees per pixel) corresponds to the chosen value of GPP (here: GPP = 1.0). The zero meridian is running horizontally from the pole to the right image border.
Results obtained with the MapMaker software package
Further maps generated with the programs MapMaker, MapMaker_Phase, and MapMaker_Phase_Polar along with measurements of the position and size of surface details in planetographic coordinates can be found among my observations of the planets Jupiter, Mars, and Mercury.
Of special interest in the case of planet Mars is the comparison of cylindrical projection maps of my CCD images in red and near-infrared light of the dust activity in the Hellas region to the measurements of the Mars Global Surveyor Orbiter in thermal infrared wavelengths. Furthermore, I documented the melting of the southern polar cap using the program MapMaker_Phase_Polar.
Links
A huge database of the positions of thousands of cloud features on planet Jupiter observed during the last 200 years can be found at http://www.jupos.org.